
Profit factor is your gross profit divided by your gross loss over a set of trades. A result of 1.5 means your winners made $1.50 for every $1.00 your losers took back. Above 1.0 you made money in that sample, below 1.0 you lost money, and most traders aim for roughly 1.3 to 2.0 once costs are counted.
That is the whole definition. The rest of this guide covers what the number hides, because a profit factor taken on its own can flatter a weak strategy or scare you away from a sound one.
TL;DR
- Formula: profit factor = total dollars won on winning trades ÷ total dollars lost on losing trades (as a positive number).
- Reading it: 1.0 is breakeven, and many systematic traders consider 1.3 to 2.0 realistic after costs. Values above 3.0 deserve suspicion.
- Context matters: it ignores how often you win, so read it next to win rate, average win and loss, and drawdown.
- Sample size and costs: a number from a few dozen trades, or one calculated before commissions and slippage, can mislead badly.
Table of Contents
- What profit factor means
- How to calculate profit factor
- What is a good profit factor?
- Profit factor vs. win rate
- Where profit factor misleads you
- What to read alongside profit factor
- How to use profit factor to make decisions
- Our perspective on profit factor
- Calculate it automatically with SpiceLog
- A note on risk
- FAQ
- Sources
What profit factor means
Profit factor measures how much a trading strategy earns for every unit of loss it takes. TradingView’s documentation describes it as a gauge of the health of a strategy’s risk-to-reward profile. Babypips’ Forexpedia defines it the same way: a ratio comparing profits from winning trades to losses from losing ones.
Two details trip people up:
- It uses gross figures. You add up every winning trade, then add up every losing trade, and divide. You do not net them first.
- It describes a sample. LuxAlgo’s explainer frames it as how much profit a chosen set of trades produced per dollar lost. Change the sample (a month, a setup, a ticker) and the number changes.
How to calculate profit factor
The formula:
Profit factor = gross profit ÷ gross loss
Here is a worked example with ten hypothetical day trades:
| Trade | Result |
|---|---|
| 1 | +$600 |
| 2 | −$200 |
| 3 | −$200 |
| 4 | +$500 |
| 5 | −$200 |
| 6 | −$200 |
| 7 | +$450 |
| 8 | −$200 |
| 9 | +$250 |
| 10 | −$200 |
- Gross profit: 600 + 500 + 450 + 250 = $1,800
- Gross loss: six losers at $200 = $1,200
- Profit factor: 1,800 ÷ 1,200 = 1.5
- Net profit: $600
- Win rate: 4 of 10 = 40%
Notice that this trader loses six times out of ten and still has a healthy ratio. That is the central lesson of the metric.
Steps to calculate it from your own history
- Export every closed trade for the period you want to judge, with net P&L per trade.
- Sum all positive results. That is gross profit.
- Sum all negative results and drop the minus sign. That is gross loss.
- Divide gross profit by gross loss.
- Repeat after removing your single best trade (more on why below).
If you would rather not do this by hand, the free trading journal template for Excel and Google Sheets gives you a place to log trades and run the sums. A journal that imports your fills computes it automatically, which removes copy-paste errors.
What is a good profit factor?
There is no official threshold. According to Build Alpha’s calculator guide, many systematic traders view 1.3 to 2.0 as realistic after transaction costs, and values above 3.0 often point to an overfitted backtest or a sample too small to mean anything.
A practical way to read ranges:
| Profit factor | What it usually tells you |
|---|---|
| Below 1.0 | You lost money in this sample. |
| 1.0 to 1.3 | Thin. Costs and a bad week can erase it. |
| 1.3 to 2.0 | A reasonable range for a live strategy, if the sample is large enough. |
| 2.0 to 3.0 | Strong, but check for a few outsized winners. |
| Above 3.0 | Verify before you trust it. Often a small sample or a flawed test. |
These bands are rules of thumb, not guarantees. Some strategies with low win rates and big winners run higher ratios, while high-frequency styles with tiny edges run lower ones.
Is a profit factor of 1.3, 1.5 or 1.8 good?
- 1.3: acceptable if it holds across a large sample and after all fees. It leaves little room for error.
- 1.5: a solid result. For every $1 lost, you made $1.50 in gross profit, the same relationship Verpips uses in its own example.
- 1.8: strong, provided it comes from enough trades and is not carried by two or three lucky days.
The answer to all three is the same: good depends on the sample, the costs and the risk you took to get there.
Profit factor vs. win rate
Win rate tells you how often you win. Profit factor tells you how much the wins outweigh the losses. You need both, because they are linked through your average win and average loss.
The relationship is:
Profit factor = (win rate ÷ loss rate) × (average win ÷ average loss)
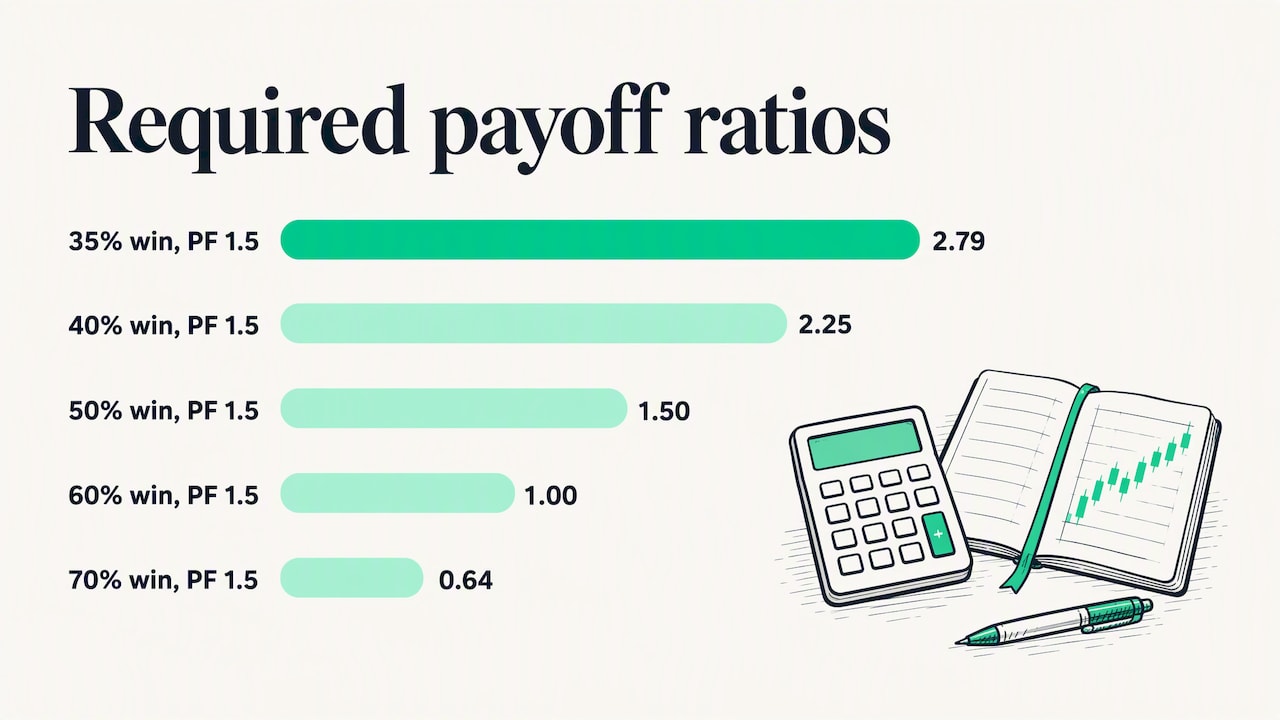
That lets you see what payoff you need at a given win rate. This table is straight arithmetic from that formula:
| Win rate | Avg win ÷ avg loss needed for PF 1.0 | Needed for PF 1.5 |
|---|---|---|
| 35% | 1.86 | 2.79 |
| 40% | 1.50 | 2.25 |
| 50% | 1.00 | 1.50 |
| 60% | 0.67 | 1.00 |
| 70% | 0.43 | 0.64 |
Two cases from the research make the point. A strategy with a 35% win rate can post a high profit factor if its winners are much larger than its losers, while a 70% win rate can still produce a profit factor below 1.0 if losses are disproportionately large, as Build Alpha notes.
Here is the second case in numbers. Twenty trades, 14 winners at $50 and 6 losers at $150:
- Gross profit: $700
- Gross loss: $900
- Profit factor: 0.78
- Win rate: 70%
This is the scalper’s trap. Many small wins feel great, then one oversized loser wipes out the week. Profit factor catches it. Win rate alone does not.
If you want to think about the payoff side directly, our guide to R-multiples for day traders shows how to measure every trade against your initial risk, which makes the average-win-to-average-loss comparison cleaner.
Where profit factor misleads you
Small samples
A high profit factor from fewer than roughly 30 to 100 trades often comes from a handful of outsized winners rather than a real edge, per Build Alpha. Its suggested check is to remove the biggest winners and see what is left.
Try it on the ten-trade example above. Remove the +$600 trade and gross profit falls to $1,200 against $1,200 in losses. The profit factor drops from 1.5 to exactly 1.0. That strategy’s edge rested on one trade.
Ignoring costs
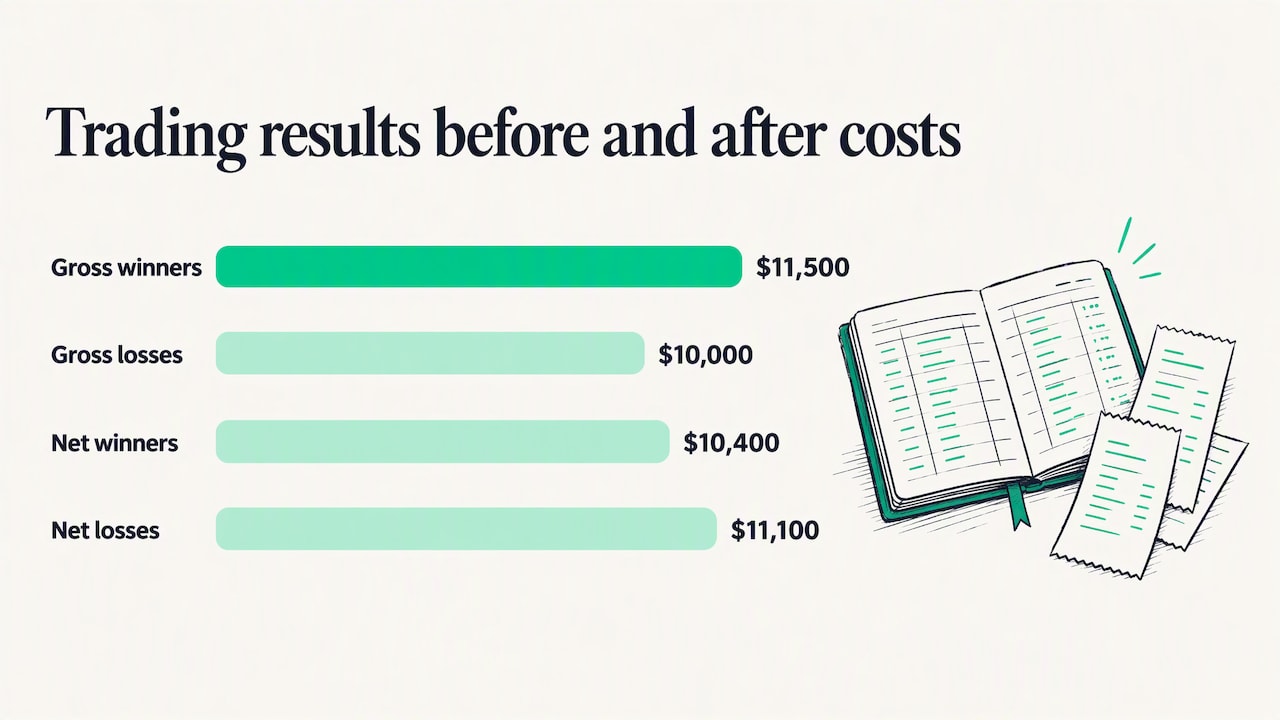
A ratio computed before commissions and slippage tends to look better than reality. LuxAlgo points out that a thin-margin strategy can slip from above 1.0 to below it once realistic costs are included.
A hypothetical: a scalper shows a gross profit factor of 1.15 on $11,500 of winners and $10,000 of losers. After fees and slippage are applied trade by trade, winners net $10,400 and losers grow to $11,100. The real profit factor is 0.94, and the strategy loses money.
Costs matter more the more you trade. FINRA’s guidance on frequent intraday trading gives an example: at $16 per round-turn trade and 29 transactions a day, a trader would need to earn more than $111,360 in a year just to cover commissions. Use your actual broker fees, not an estimate.
Chasing the number
Practitioners warn against making a high profit factor the goal. LuxAlgo notes that this obsession can tempt traders to skip necessary small losses or ignore the risk of large drawdowns. If you hold a loser past your stop to keep the ratio pretty, you have optimized the metric and damaged the account.
It says nothing about consistency
Two traders can both show 1.6. One earns it steadily; the other earns it in one lucky month and bleeds the rest of the year. Profit factor does not show the path. For that, you need drawdown, expectancy and a calendar view of daily results.
What to read alongside profit factor
A useful performance review looks at a small set of numbers together. Investopedia’s guide to strategy performance reports lists net profit, profit factor, percent profitable and average trade among the key items for evaluating a system.
Our short list:
- Win rate and payoff ratio: to see how you get to your profit factor.
- Expectancy: the average amount you expect to make per trade, in dollars or in R.
- Maximum drawdown: the worst peak-to-trough decline, which tells you whether you could survive the strategy emotionally and financially.
- Trade count: so you know how much weight the number can bear.
- Profit factor by setup or time of day: this is where the number turns actionable.
How to use profit factor to make decisions
A single all-time figure is a headline. Slicing it is the work.
- Split by setup. If your opening-range breakouts run 2.1 and your afternoon reversals run 0.7, you have your answer about where to trade less.
- Split by session. Many day traders find their results cluster in a narrow part of the day. Compare the first hour with the rest.
- Track it on a rolling window. Compare the last 50 or 100 trades with your longer history. A falling rolling number is an early warning.
- Tag mistakes. Compute the profit factor with and without trades you tagged as rule violations. The gap is the price of poor discipline, in dollars.
- Re-test after changes. After you change a stop or a target, wait for a meaningful sample before judging. Ten trades prove nothing.
A weekly review is the natural place for this. Our piece on why most day traders lose and how a weekly review helps walks through a routine for it.
Our perspective on profit factor
We built a journal for U.S. stock and ETF traders, so we look at this number every day, and our view is plain: profit factor is the best single-number sanity check and a poor decision-maker on its own.
What we see is that traders rarely get hurt by not knowing the formula. They get hurt by trusting one summary figure over the trades behind it. A 1.8 built from 25 trades, with one huge day, is a story. A 1.3 built from 400 trades across different market conditions is evidence.
Three habits separate the traders who use it well:
- They look at the number after removing their best trade.
- They look at it by tag, not just in total, so the number points to something they can change.
- They treat it as a trailing indicator: it tells you what happened, and your journal notes tell you why.
This is also why we make every report free. Breaking your profit factor down by setup, session and mistake should not sit behind a paywall, because that breakdown is where the number becomes useful.
The rest is discipline, and nobody can compute that for you.
— Monte
Calculate it automatically with SpiceLog
Doing this in a spreadsheet works for your first hundred trades. After that, the cleanup gets old. SpiceLog is a free trading journal for U.S. stock and ETF traders. It imports your trade history from brokers and platforms including DAS Trader Pro, Interactive Brokers, Schwab, thinkorswim and PropReports, then generates reports on win rate, profit factor, drawdown, expectancy and R-multiples. You can tag setups and mistakes, then compare results by tag and session. All features and unlimited imports are free.
DAS Trader Pro user? See the free DAS Trader Pro trading journal page, and our guide to exporting your DAS Trader Pro trade log. To size trades so a single loss cannot wreck your ratio, try the position size calculator.
A note on risk
A good profit factor does not make day trading safe. FINRA says frequent intraday trading carries significant risks, especially with margin, and that investors should never fund it with money they cannot afford to lose; its overview of frequent intraday trading is worth reading before you scale up. If you are unsure whether active trading fits your finances, talk with a registered financial professional. For the latest on margin requirements, see FINRA’s discussion of its intraday margin standard.
FAQ
What is profit factor in trading?
It is the ratio of gross profit to gross loss over a set of trades. A profit factor of 1.5 means you earned $1.50 for every $1.00 lost. Anything above 1.0 means the sample was profitable before anything not captured in your trade data.
What is a good profit factor?
Many systematic traders treat 1.3 to 2.0 as realistic once transaction costs are included, and they treat values above 3.0 with suspicion. There is no official standard. Judge the number by its sample size, the costs included and the drawdown it came with.
Is a high win rate or a high profit factor more important?
Neither works alone. Win rate shows how often you win; profit factor shows whether the wins outweigh the losses in dollars. A 70% win rate can still lose money if your losers are big, so check both along with average win and average loss.
How many trades do I need for a reliable profit factor?
A figure from fewer than about 30 to 100 trades is frequently misleading. Remove your best few trades and recalculate: if the number collapses toward 1.0, the edge probably depended on outliers. More trades across varied market conditions make it more trustworthy.
Should profit factor include commissions and fees?
Yes. Without costs, the ratio often looks better than reality, and a thin edge can turn into a loss. Use net P&L per trade, including commissions, fees and any slippage you can measure.
Sources
- Profit factor, TradingView Support
- Profit Factor Definition, Forexpedia by Babypips
- Profit Factor in Trading: Basics Explained, LuxAlgo Blog
- Profit Factor Calculator, Build Alpha
- What is profit factor? Verpips glossary
- Interpreting a Strategy Performance Report, Investopedia
- Frequent Intraday Trading: Understanding the Basics, FINRA
- FINRA’s Intraday Margin Standard, FINRA


Leave a Reply